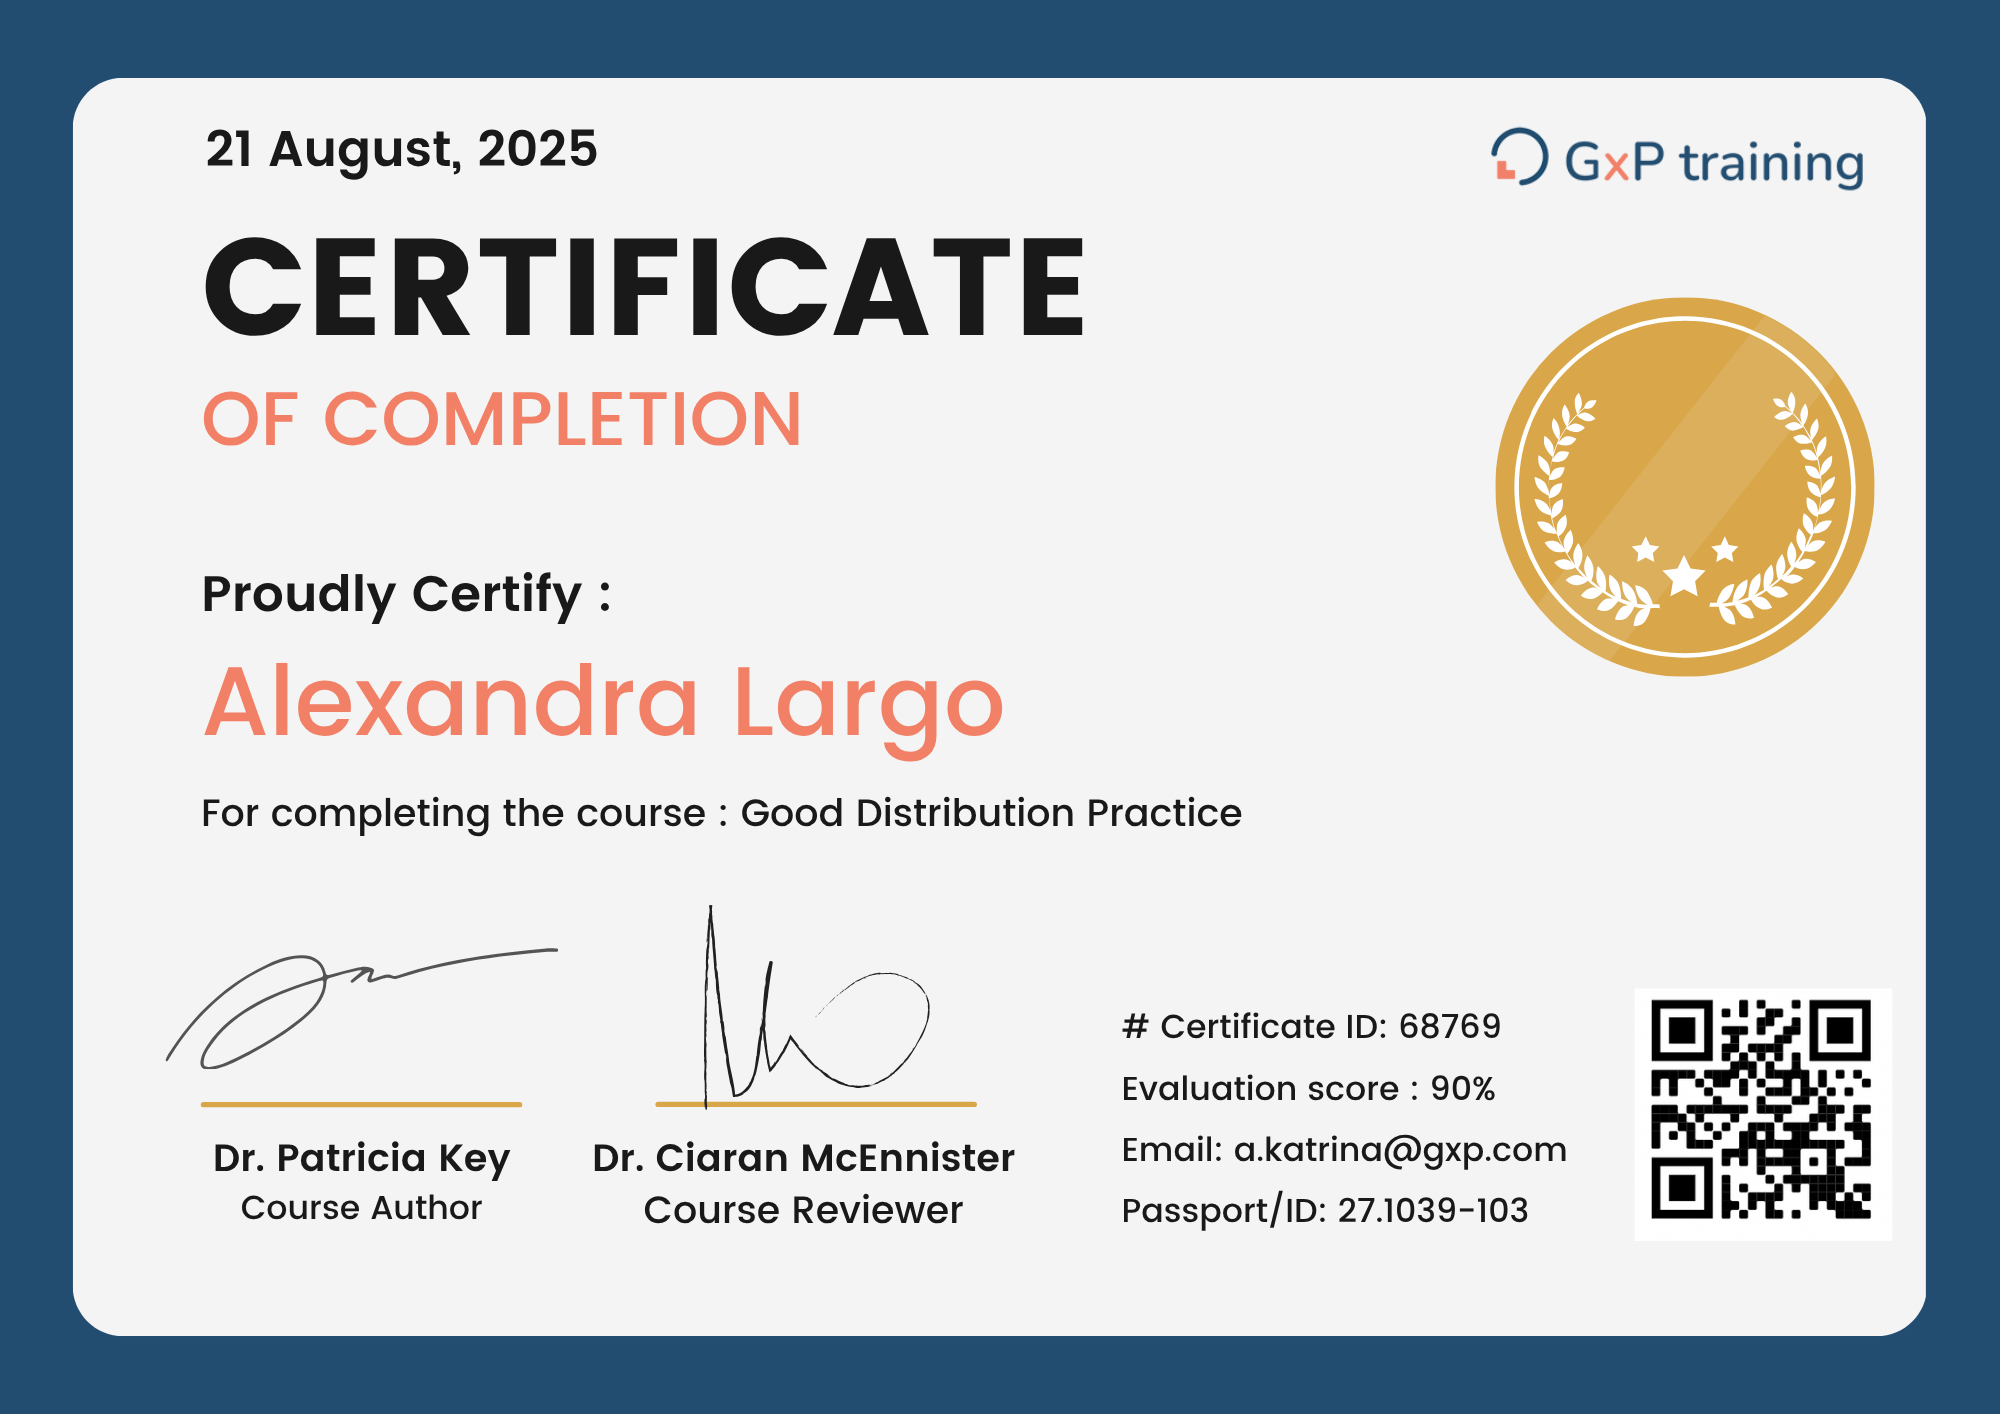
Successful completion provides learners with a dated, traceable and downloadable certificate for the course :
Each certificate is CPD/CEU accredited and 21 CFR PART 11 compliant. Certificates validity can be checked online through our certificate online checker. They can also be shared on Linkedin.
Description:
In addition to the efficacy and safety of pharmaceutical products and devices, a major goal of the manufacturing process is the uniformity of products. Hence pharmaceutical companies use statistical process controls (SPC) to contain the stability, variability, and capability of the manufacturing process. This course introduces you to the basics of calibrating processes and determining standards for evaluation of the reproducibility of the products of your manufacturing process. It includes lessons on control charts, measures of central tendencies, measures of variability, and other statistical tools.
In this course, we provide a synthesis of the topic through an interactive online experience. This material was built by a team of Regulatory Affairs Experts with a Qualification from Northeastern University, Boston, piloted by a Senior Member able to articulate theory with practice.
Curriculum
Introduction
What Is a Process?
Why Is There a Need to Have a Statistical Process Control?
Emphasis on the Need for Process Understanding and Control
Are There Any Guidelines Available for The Statistical Process Control?
The Goal of Statistical Process Control
What Is a Variation?
What Are the Sources of Variations?
What Are Control Charts?
Lesson 1: Statistical Basis of the Control Chart
The Mean
The Range and Standard Deviation
Distribution of Data
What is the Median
Lesson 2: Control Charts
Basic Principles
How to Plot Control Charts
Types of Control Charts
Lesson 3: The x-Bar Charts
Estimating Central Tendency of the Process
What If Some Observations Do Not Appear Within Control Limits?
X-Bar Charts Estimating Variability of the Process
Lesson 4: The Range (R) Charts
Lesson 5: The p-Charts
Lesson 6: The c-Charts
Conclusion
Glossary
Quiz
Author:
Dr. Khurram Rehman
Dr. Khurram Rehman is a Pharmacist and an Academician. He received his Master in Pharmaceutical Analysis and Doctor of Philosophy in Pharmacy from the National University of Malaysia (Universiti Kebangsaan Malaysia). He has several years of professional experience working in the Pharmaceutical Industry and Research and Development organizations. Currently, he is actively involved in academia and research and has many publications to his name. In addition, he has a keen interest in Pharmaceutical Analysis, Quality Management, and Drug Delivery Sciences. He firmly believes that bringing academia and industry together can only ensure continuous professional development, up-to-date knowledge, and the best productivity.
Reviews:
Rated 4.5 out of 5
(64 reviews)
Thanks to GxP Training, the team is now equipped with statistical skills concerning the control, monitoring, and optimization of the manufacturing process. We expect that the interpretation of statistical concepts and values will no longer be a problem